
The power industry is experiencing a big shift. More renewable resources are being included in the power generation mix and several states are setting ambitious green energy goals. Policy announcements have become more frequent in recent months, yet there has been little discussion of the power infrastructure changes or associated costs required to achieve 100% renewable energy goals.
Admittedly, these are difficult conversations. It’s hard to know how technologies will evolve or what consumption and energy prosumers will look like 10 years from now. Some current assumptions — for instance, that the cost of renewables will continue to decrease or that customers are willing to pay more for renewables — may not stand the test of time. A tendency to focus on annual data glosses over the challenge of balancing supply, demand and environmental conditions on an hourly, and even subhourly, basis.
Further complicating matters is the 20- or 30-year investment timeline for major infrastructure. Turning back from these decisions is costly and nonproductive. Every available technology must be evaluated carefully in advance. Legislation proposed recently in Florida provides an interesting example of how to go about identifying the most cost-effective way to service customer loads with renewable resources.
Read The White Paper
The power industry is experiencing a big shift. More renewable resources are being included in the power generation mix and several states are setting ambitious green energy goals. Policy announcements have become more frequent in recent months, yet there has been little discussion of the power infrastructure changes or associated costs required to achieve 100% renewable energy goals.
Admittedly, these are difficult conversations. It’s hard to know how technologies will evolve or what consumption and energy prosumers will look like 10 years from now. Some current assumptions — for instance, that the cost of renewables will continue to decrease or that customers are willing to pay more for renewables — may not stand the test of time. A tendency to focus on annual data glosses over the challenge of balancing supply, demand and environmental conditions on an hourly, and even subhourly, basis.
Further complicating matters is the 20- or 30-year investment timeline for major infrastructure. Turning back from these decisions is costly and nonproductive. Every available technology must be evaluated carefully in advance. Legislation proposed recently in Florida provides an interesting example of how to go about identifying the most cost-effective way to service customer loads with renewable resources.
Moving the Goalpost
In March 2019, Florida legislators introduced an energy bill (HB 1291/SB 1762). This bill sought to transition the state to 100% renewable energy by 2050 with an interim goal of reaching 40% renewable energy by 2030. While the timeline was not as aggressive as similar proposals, its intent was clear: to overhaul the energy generation mix in Florida over the coming decades.
The Florida bill called for the state’s renewable energy plan to “consider the potential impact of existing and additional renewable energy incentives and programs with an emphasis on solar and distributed resources, including energy storage.” This paper looks at supplying 100% of the net energy requirements for load in every single hour by considering a conversion around these parameters.
Evaluating the Mix
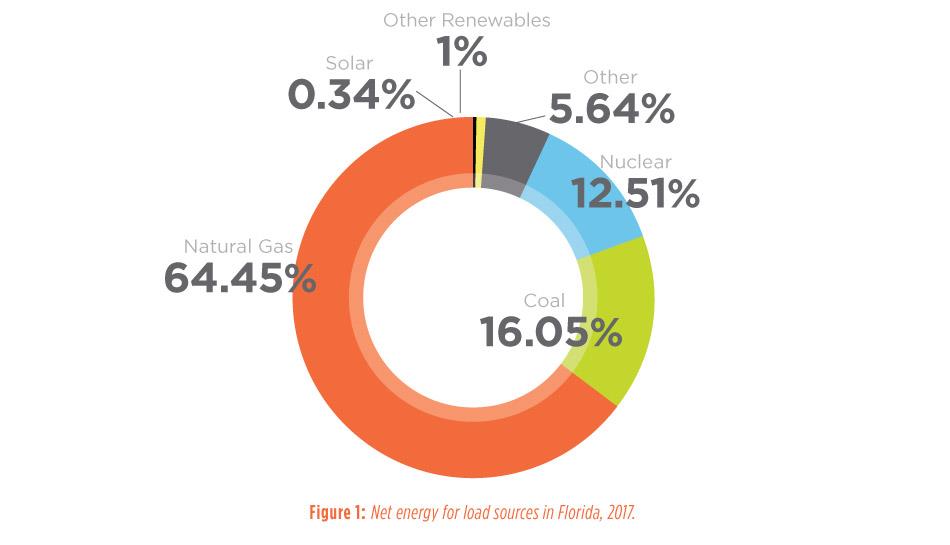
According to the 2018 Regional Load & Resource Plan (L&RP), Florida utilities within the Florida Reliability Coordinating Council (FRCC) footprint supplied annual net energy for load of 232,395 GWh in 2017. The net energy for load includes the effects of reducing total energy requirements through the contributions of self-served generation and residential and commercial/industrial conservation.
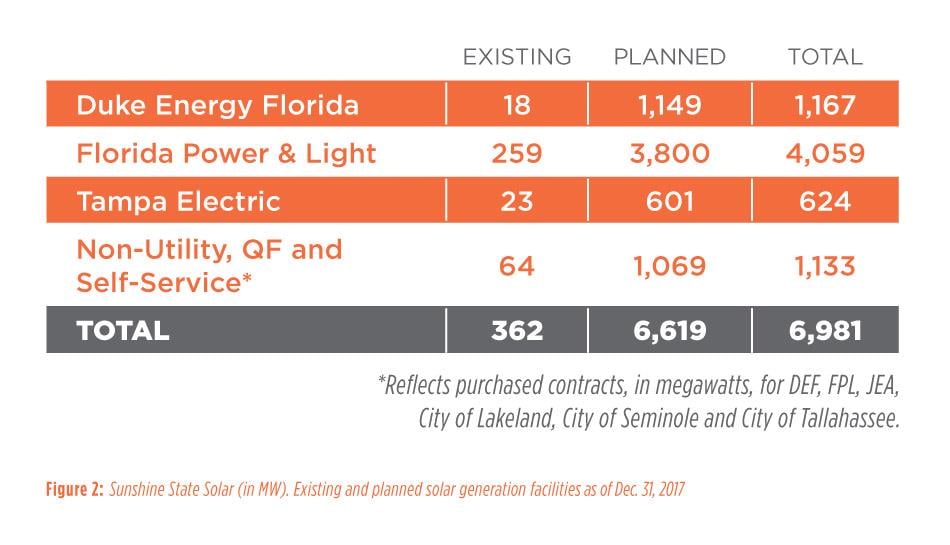
The mix of energy sources used to supply this electric demand is shown in Figure 1. As of Dec. 31, 2017, solar supplied 0.34% of demand, which corresponds to approximately 362 MW of nameplate facilities as seen in Figure 2. (All solar values are presented on an alternating current, or AC, basis.)
While Florida’s historical renewable energy production numbers are relatively low, utilities within the state are poised to significantly increase the amount of nameplate solar facilities. In total, the L&RP includes more than 6,600 MW of new solar projects to be subscribed by utilities in 2018 and beyond. More recent announcements — such as Florida Power & Light’s (FP&L) “30 by 30” initiative; the Florida Municipal Power Agency (FMPA) Florida Municipal Solar Project; the Duke Energy Florida 700 MW by 2021; and other projects — will add even more solar to the state’s grid over the next 10 years.
Filling the Gaps
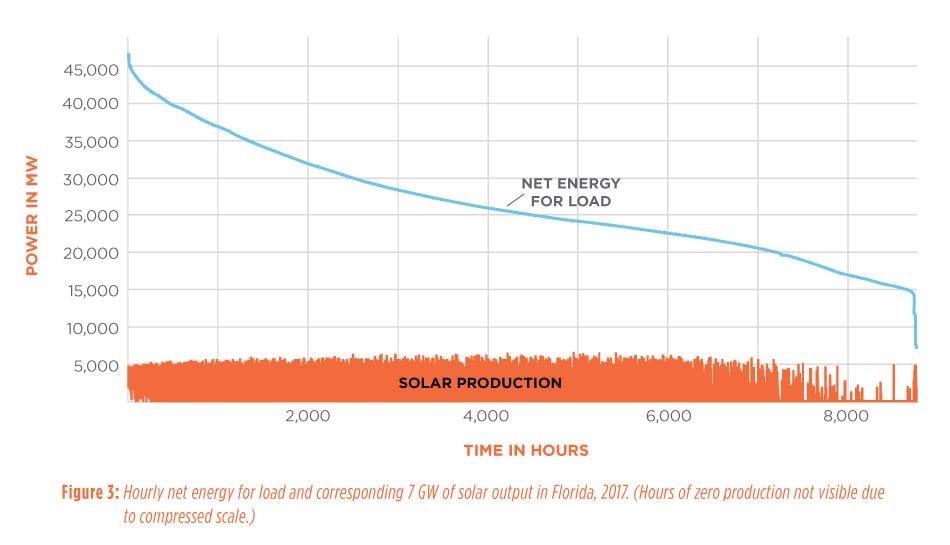
The National Renewable Energy Laboratory’s (NREL) System Advisor Model (SAM) can be used to project solar production. Assuming the nearly 7 GW of solar included in the L&RP were built using single axis tracking (SAT) and dispersed throughout the state, the SAM model calculates annual production of 15,711 GWh. This would be enough renewable energy to serve nearly 7% of the net energy for load in 2017. As shown in Figure 3, in most hours a sizable gap remains between the net energy for load and the assumed production from this 7 GW of solar.
Historically, resource adequacy has focused on generating enough energy to meet the peak demand; however, the low solar production hours at lower net energy demand times also need to be addressed. In a 100% renewable energy fleet, this challenge must be resolved through energy storage or other forms of renewable generation. Florida could also consider ways load can be shifted to better match renewable generation, with the goal of moving the grid from a load-following to a supply-following model.
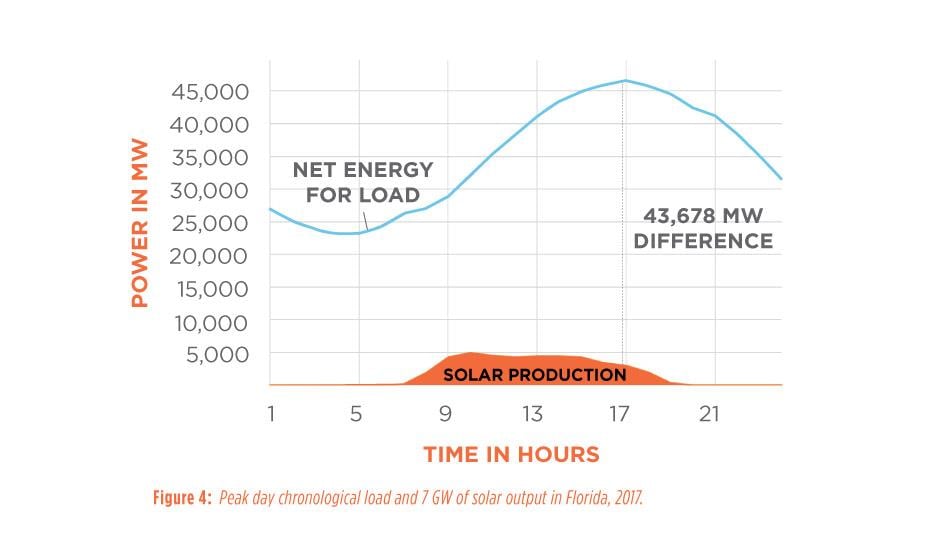
Focusing on the peak demand hour within the FRCC footprint, Figure 4 shows the chronological load and solar profile on the day corresponding to the peak hour. A difference of nearly 43,700 MW is observed between the peak net energy for load hour and production of nearly 7 GW of solar.
A variety of renewables, such as hydro, onshore wind, offshore wind, biomass and nuclear, could be considered to serve this load. One alternative that would fill approximately 3,600 MW of the delta is to assume existing nuclear facilities in Florida (St. Lucie Units 1 & 2 and Turkey Point Units 3 & 4) remain part of the future energy portfolio. Another alternative would be to add more solar generation. This could be some combination of utility-owned, utility-purchased or behind-the-meter distributed energy resources.
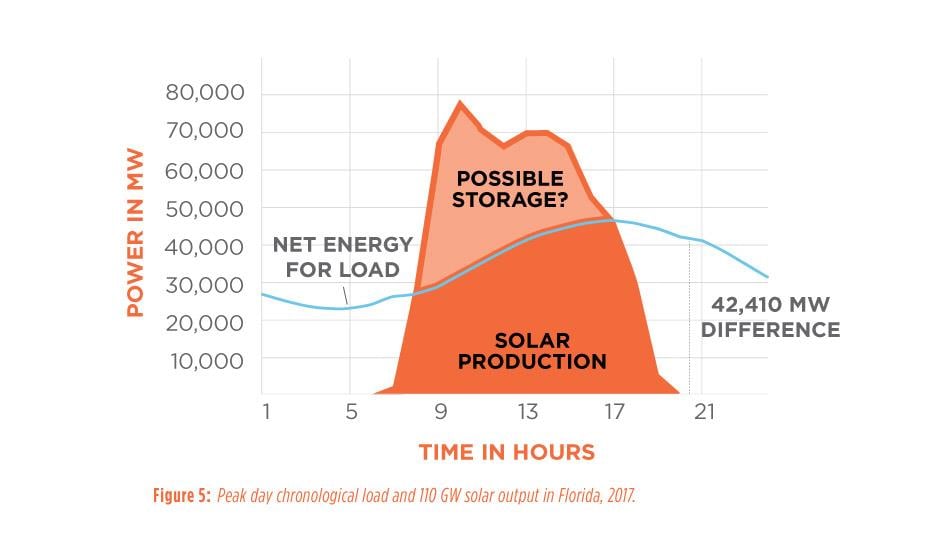
If we assume a consistent solar output profile for all new solar regardless of the installation type/size, approximately 110 GW of solar would be required. Assuming 5 acres per 1 MWac, 110 GW of solar would require approximately 550,000 acres, or about 860 square miles of land area. This is nearly the same amount of space as the City of Jacksonville, which is the largest city by area in the contiguous United States, according to the U.S. Census.
Figure 5 shows the solar production at the 110 GW installation level relative to the peak day net energy for load requirements. Building up to 110 GW of solar would satisfy the peak net energy for load hour. However, the largest gap between solar production and net energy for load remains nearly the same as it was during the peak net load hour before 110 GW of solar was added. The gap has shifted to three hours later, but at more than 42,000 MW, the net energy for load is still relatively high.
The renewable alternatives mentioned previously — including hydro, onshore wind, offshore wind, biomass and nuclear — could serve this load. Installing even more solar or changes in the demand-side consumption pattern could also be part of the final alternative mix. It is oversimplifying this problem to say that 42 GW of energy storage or other form of dispatchable generation would be needed. Yet, at least that much would be required based on the 2017 load.
Investment Cost Illustration
While it is difficult to determine the exact cost of 100% renewable energy scenarios without more specifics, it is possible to estimate the potential investment required. The NREL Annual Technology Baseline (ATB) 2018 includes cost characteristics for new generating technologies that are useful in this process.
In accordance with this report, we can assume the constant overnight capital cost for unsubsidized utility-scale tracking photovoltaic (PV) is $1,387/kW and battery storage is $1,824/kW. This would make the incremental cost of 103 GW of solar and 42 GW of battery storage approximately $220 billion.
It’s also important to note that it is favorable to apply utility-scale costs for the entirety of the project. For comparison purposes, conventional combined-cycle is estimated to cost $1,041/kW, or approximately 75% of the cost of solar or 57% of the cost of battery storage.
Both proponents and opponents of renewable energy will find reasons to dislike these assumptions; nonetheless, they provide a good starting point for essential discussions around the cost of renewable power.
Looking Ahead
Without further direction on resource preferences and cost tolerance, it would be nearly impossible to provide a clear road map for Florida to reach its proposed 100% renewable energy goals. Instead, our hope is to illustrate the scope of the infrastructure changes required and the value that diversity of resources may provide in supporting lower overall costs. But regardless of the precise final cost, achieving a truly 100% renewables goal in all hours would be expensive.
This exercise also raises several other critical questions, including:
- What duration of energy storage would be needed given the remaining load to be served?
- What other generation technologies will complement the leading low-cost technologies of today?
- What role will future rate design play in energy consumption behaviors and patterns?
- What level of investment will be needed at the distribution and transmission levels to reliably and efficiently deliver the renewable energy?
These questions can be answered if the desired goals and acceptable outcomes are sufficiently defined.
Informed decision-making requires complex analyses and broad consideration of operational challenges and associated costs. As Florida and other states consider and implement plans to dramatically increase renewable energy generation capabilities, integrated resource planning that explores all available technologies relative to evolving energy needs, existing assets and overall cost-effectiveness will be essential to long-term success.
Definitions of ‘Renewable’ Can Vary
It is important to note that the resources that are considered acceptable in the context of a 100% renewables goal vary in different regions of the country. Though it might seem that all resources that do not produce greenhouse gas emissions would qualify as “renewable,” concepts such as “net zero” leave room for interpretation.
What Utilities Can Do Now To Plan for 100% Renewable Goals
There are several activities that utilities and regulators can consider when starting down a path that leads to 100% renewable energy:
- Review distribution standards and circuit hosting capacity in preparation for two-way power flows.
- Consider trade-offs in transmission investment for remote, high-production generation as compared to local, low-production generation.
- Identify opportunities and impacts of electrification as a means to support renewable initiatives.
- Perform integrated resource planning (or similar efforts) that look at future portfolio mix and tradeoffs between large-scale and local generation and transmission and distribution investments.
- Review rate outlook based on investment needs and timing.
Keeping this list top of mind while building a road map can better prepare an organization for reaching its goal.
Additional Cost Considerations
A number of additional factors could impact the cost of achieving 100% renewable energy goals in Florida:
Why the Costs Could Be Lower
- Future installations will take advantage of declining costs. EIA data shows the cost for new utility-scale PV systems has come down more than 50% since 2013.
- Technology breakthroughs, such as bifacial panels, will improve the efficiency of future installations. Future rate design will shift consumption to peak renewable energy production hours, reducing the amount of storage needed.
- Efficiency improvements for existing buildings, appliances, new construction and other factors will reduce overall demand below current projections.
- Additional federal or state subsidies, such as tax incentives, may be available.
Why the Costs could Be Higher
- In this example, 2017 figures were used. If economic and population growth continues, future demand will be higher.
- No reserve margin requirement was included, which could necessitate an additional 10% or more in nameplate capacity.
- Continuing electrification of the economy, particularly in the transportation sector, will increase demand above current projections.
- Utility-scale costs were assumed. Smaller projects at the distribution level will incur higher dollars in per-kW costs. Solar projects built in Florida may require greater investment to withstand hurricanes, or cheaper installations may have to be replaced sooner.
- Battery storage duration will need to cover 10 to 12 nondaylight hours, which is longer than the maximum 4-hour duration of current lithium-ion battery deployments.


.svg)